Mortgage Rates Today: Latest Rates & Payment Trends
Mortgage rates sound simple until you actually try to use them to make a decision. One headline says..
Mortgage rates sound simple until you actually try to use them to make a decision.
One headline says rates are “down,” another says they’re “still high,” and neither tells you what that means for your monthly payment.
This Mortgage Rates page is built around a calculator-first approach, not news noise.
Instead of guessing or trusting averages that may not apply to you, the goal here is to help you understand how mortgage rates translate into real numbers, payments, long-term interest, and affordability.
Whether you’re buying your first home, comparing lenders, or just tracking where rates are heading, this page helps you connect rate changes to practical outcomes.
Average Mortgage Rates
Average mortgage rates give homebuyers and homeowners a realistic benchmark of what most borrowers are paying in the market, not just the lowest advertised deals.
These averages are influenced by inflation, central bank policy, bond yields, and lender competition, which is why rates can change weekly or even daily.
Tracking average rates is especially useful when comparing fixed vs variable loans, estimating monthly payments, and deciding whether refinancing is worth it.
Explore How Mortgage Rates Work, and use our Mortgage Calculator to see how small rate changes impact long-term interest costs.
📉 Rate Low Cycle: 2020–2021 marked historic mortgage lows due to monetary stimulus and strong refinancing demand.
📈 Rate Spike Cycle: 2023–2024 peaked as inflation forced central banks to raise interest rates aggressively.
🏠 Borrower Impact: a small 0.50% increase can add hundreds per month on long-term loans and raise total interest paid dramatically.
📊 Data Reference: annual averages are based on estimated U.S. 30-year fixed mortgage rate history for market trend comparison.
Mortgage rate history shows how quickly mortgage rates today can change. From 2010–2011, rates stayed near 4%-4.7%, then dropped to historic lows under 3% in 2020-2021.
By 2023-2024, current mortgage rates surged to 6%–6.8%, making monthly payments significantly higher.

How mortgage rates actually work?
Mortgage rates are essentially the cost of borrowing money for a home, but they’re not set in a simple or uniform way. What most people call a “mortgage rate” is influenced by broader interest rates, lender pricing models, loan type, and borrower risk.
That’s why two buyers on the same day can see very different offers.
A calculator helps cut through this by showing how even a small rate difference impacts monthly payments and total interest over time.
Instead of focusing on the lowest advertised number, it’s more useful to understand how rates interact with loan term, down payment, and credit profile.
This approach keeps you grounded in real affordability rather than chasing headlines.
Using a mortgage rate calculator to compare options realistically
A mortgage rate calculator isn’t just for finding a payment number, it’s a comparison tool.
By adjusting the rate, loan term, and loan amount, you can see how different scenarios play out over years, not just months.
This is especially helpful when deciding between shorter and longer terms or when comparing lender quotes that look similar at first glance.
Many buyers are surprised by how much total interest changes with even a small rate adjustment.
If you’re still early in the process, pairing this with guidance from a first-time home buyer guide can help you understand where these numbers fit into the bigger picture without rushing decisions.
Fixed vs adjustable rates and why the difference matters
Fixed-rate mortgages offer stability, the rate stays the same, which makes long-term budgeting easier. Adjustable-rate options often start lower but can change later, which introduces uncertainty.
A calculator allows you to model both paths side by side instead of relying on assumptions.
For some buyers, the predictability of fixed rates outweighs short-term savings.
For others, adjustable options can make sense depending on how long they plan to stay in the home. Understanding this distinction early prevents surprises later.
If you want deeper context on loan structures, mortgage basics explained simply for first-time home buyers pairs well with calculator-based exploration.
What influences the rates you actually qualify for
The rate you see online is rarely the rate you’ll get. Lenders adjust pricing based on credit history, debt levels, down payment size, and loan program.
Market conditions matter, but personal factors often matter more. This is why calculators work best when paired with realistic inputs rather than best-case assumptions.
If you’re unsure where you stand, learning what credit score you need to buy a home can help you estimate whether quoted rates are realistic for your situation.
Comparing lenders without getting overwhelmed
Comparing mortgage rates isn’t about checking dozens of websites, it’s about understanding how lender offers differ once fees, points, and terms are factored in.
A calculator helps normalize those offers by translating them into monthly and lifetime costs. This makes it easier to spot when a “lower rate” actually costs more over time.
Many buyers find this step clarifies conversations with lenders instead of replacing them.
If you’re unsure when to start these comparisons, where to start with mortgages as a new buyer provides a helpful roadmap.
Tracking mortgage rate trends without timing the market
Trying to perfectly time mortgage rates rarely works. Rates move based on economic data, policy decisions, and market expectations, most of which are unpredictable.
Instead of waiting for the “perfect” rate, many buyers use calculators to test affordability across a range of possible rates.
This helps answer a more practical question: “Can I still afford this home if rates change slightly?”
If you’re curious how these shifts happen, what causes mortgage rates to go up or down offers useful context without turning it into market speculation.
How mortgage rates affect long-term homeownership costs
Mortgage rates don’t just affect monthly payments, they shape the total cost of owning a home over decades. A slightly higher rate can add tens of thousands in interest over a full loan term.
Using a calculator to see amortization effects helps buyers understand where their money actually goes.
This is especially important when deciding whether refinancing later might make sense. If you’re thinking ahead, can first-time buyers refinance later connects naturally with this type of planning.
When a mortgage rate calculator is most useful
Rate calculators are most powerful before you’re locked into a decision. They help during early planning, lender comparison, and even during rate lock discussions.
After closing, they’re still useful for tracking whether refinancing could reduce costs. The key is using them as a decision-support tool, not a prediction engine.
When combined with realistic expectations, calculators reduce anxiety and improve confidence in conversations with lenders.
Frequently Asked Questions
Mortgage Calculator
Recommended Mortgage Tools
Refinance Break-Even Calculator
See how long it takes to recover refinance costs.
Debt-to-Income Ratio Calculator
Check if your income supports mortgage approval.
Refinance Readiness Checker
Find out if now is the right time to refinance.
Mortgage Eligibility Checker
Quickly see if you qualify for a home loan.
First-Time Buyer Readiness
Know if you're ready to buy your first home.
Mortgage Pre-Approval Calculator
Estimate how much you can borrow instantly.
Related Posts
Featured Mortgage Insights
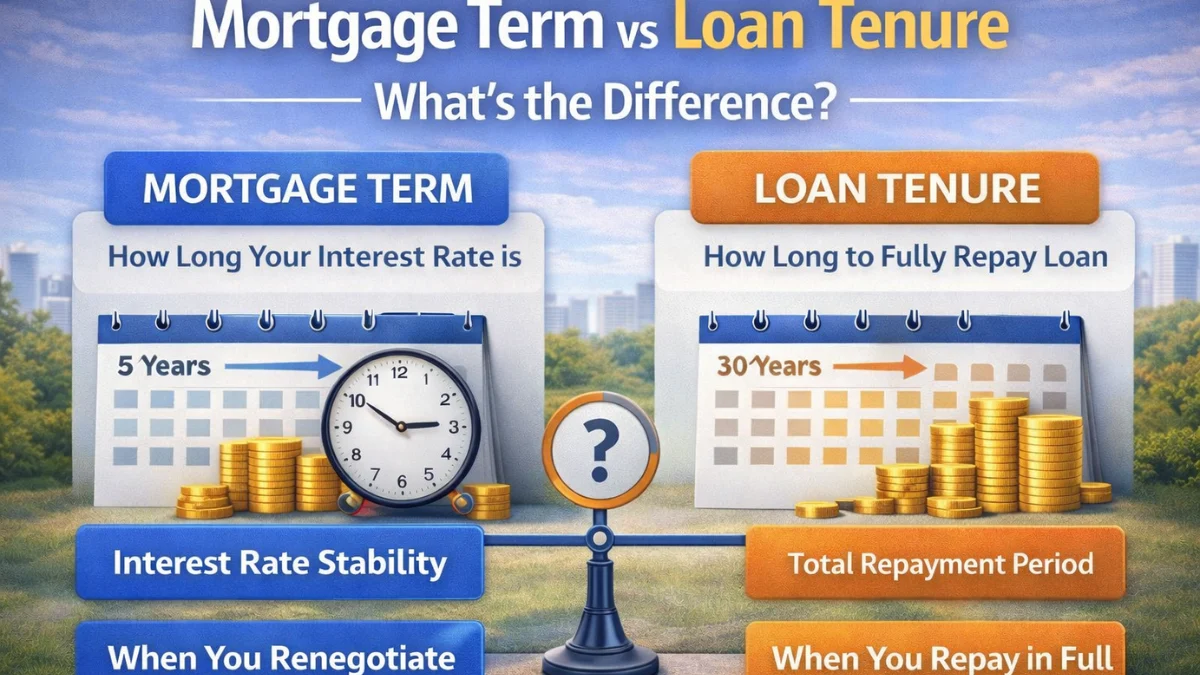
Mortgage term is the period your interest rate is fixed, while loan tenure is the total time to repay the loan. Both impact payments, refinancing, and total interest.

Featured Mortgage Insights
Mortgage rates are influencing buyer budgets more than expected as borrowing costs directly affect monthly payments and long-term affordability. Many buyers are adjusting spending limits and home search plans to align mortgage commitments with financial stability.
Featured Mortgage Insights
Many homebuyers are closely watching mortgage rates before making property offers, as borrowing costs directly influence affordability and monthly payments. Rate movements are increasingly shaping purchase timing and buyer confidence across today’s housing market.